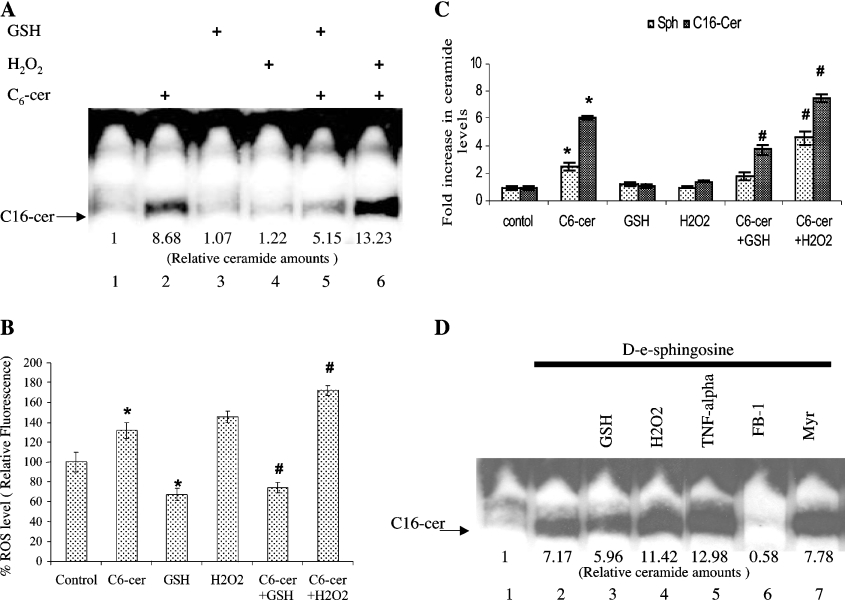
Figure 2. Regulation of the recycling pathway for the generation of ceramide by ROS.
(A) Cells were pre-treated with 15 mM GSH (lane 5) or 100 μM H2O2 (lane 6) for 2 h, which was followed by treatment with 20 μM C6-cer for an additional 2 h (lane 2), and their effects on the generation of long-chain ceramide formation was measured by palmitate labelling, compared with controls (lane 1). Lanes 3 and 4 contain samples treated with GSH and H2O2 alone. The quantification of ceramide bands are shown beneath the lanes. (B) Cells were treated with GSH and H2O2 as in (A) in the presence or absence of C6-cer, and endogenous ROS levels were measured using DCFH-DA as indicated in the Experimental section. (C) The levels of endogenous ceramides were determined using HPLC/MS after treatment of cells with C6-cer (2 h) following 15 mM GSH or 100 μM H2O2 for 2 h. The results shown are representative of three independent experiments performed in duplicate. (D) Cells were treated with or without 5 μM D-e-Sph in the presence of 1 μCi/ml of [3H]palmitate for 2 h, without (lane 2), or with (lane 3) 15 mM GSH, 100 μM H2O2 (lane 4), 2 nM TNF-α (lane 5), 50 μM FB1 (lane 6) or 50 nM MYR (lane 7). Lane 1 contains untreated control. Results are means±S.D. * and #, P<0.05 compared with controls or ceramide alone respectively.

