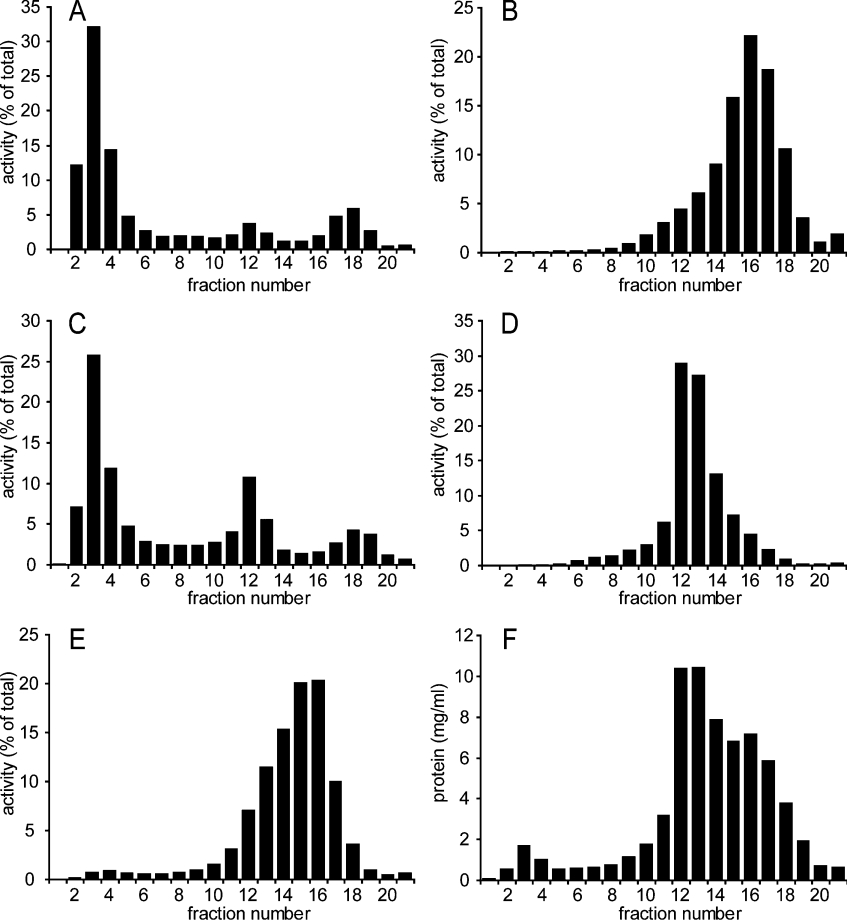
Figure 7. Subcellular distribution of CoA diphosphatase activity in mouse kidney.
A post-nuclear supernatant of kidneys from nine male mice was prepared and subjected to equilibrium density-gradient centrifugation using a linear 20–35% (w/v) Nycodenz gradient as described by Wanders et al. [7]. After centrifugation, the gradient was fractionated, and marker enzymes and CoA diphosphatase activities were measured in all fractions: (A) catalase (peroxisomes); (B) β-hexosaminidase (lysosomes); (C) CoA diphosphatase; (D) glutamate dehydrogenase (mitochondria); (E) esterase (microsomes); and (F) total protein concentration. Results are percentages of total activity observed (A–E) or mg/ml protein (F).

