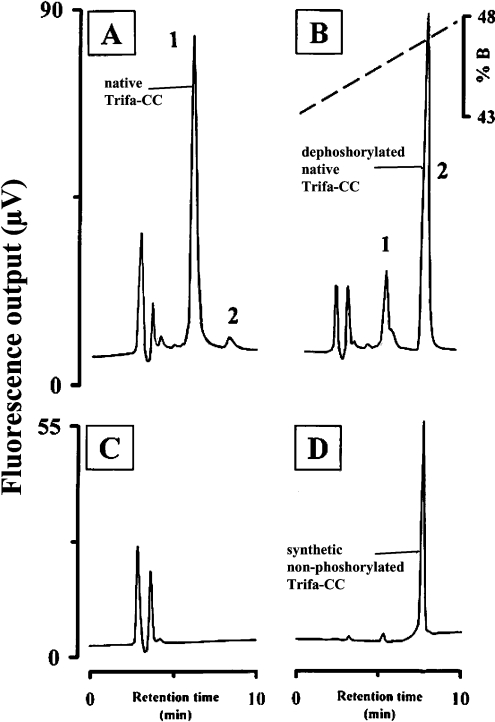
Figure 4. Dephosphorylation of native Trifa-CC from T. fascicularis by alkaline phosphatase.
Analyses were performed as in Figure 1, except that the gradient ran from 43 to 53% B within 20 min at a flow rate of 1 ml·min−1. The fluorescence traces (276 nm excitation and 350 nm emission) are depicted for (A) an incubation of native Trifa-CC with alkaline phosphatase immediately after the start of reaction and (B) after 90 min of incubation. (C) The trace from injection of the incubation medium (with enzyme but without peptide). (D) The trace from an injection of 10 pmol of synthetic nonphosphorylated Trifa-CC.

