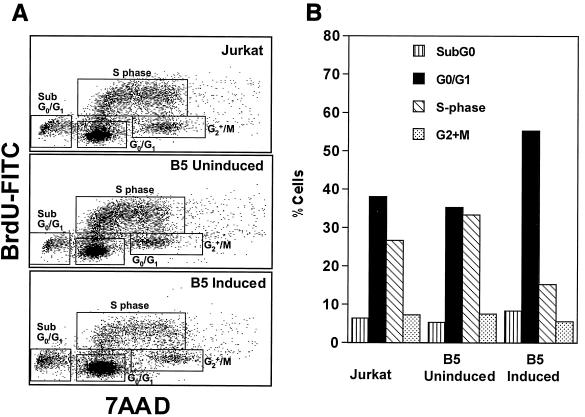
FIG. 4.
BrdU incorporation and DNA content analysis. Cells were cultured with 10 μM BrdU for the final 1 h of the culture. Cell-incorporated BrdU (measured with FITC-conjugated anti-BrdU antibody) and total DNA content (measured with 7-AAD) were analyzed by flow cytometry. The proportions of cells at sub-G0/G1, G0/G1, S, and G2 plus M phases of the cell cycle were identified. (A) Dot plots showing percentages of cells in different phases of the cell cycle for Jurkat, B5 uninduced, and B5 induced cells. The data are representative of four independent experiments. (B) Bar graph showing the percentages of cells at various phases of the cell cycle.

