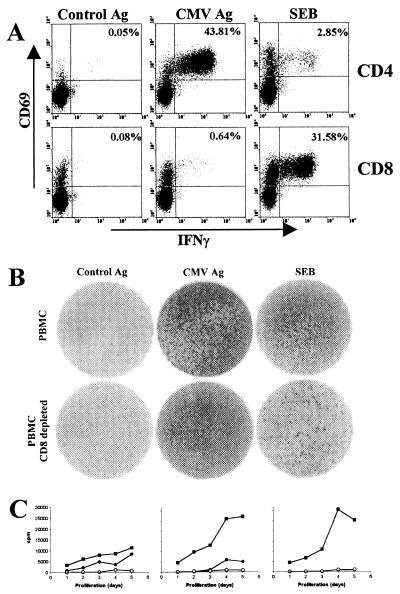
FIG. 2.
Detection of CMV-specific CD4 T cells. (A) Whole blood of a CMV-positive individual (#0320) was stimulated with control antigen, CMV antigen, or SEB, and specifically induced cytokine induction in CD4 and CD8 T cells was analyzed using flow cytometry. Numbers indicate percentages of specifically stimulated CD4 T cells. (B) Determination of CMV-specific T cells using the ELISPOT assay. IFN-γ secretion from 2 × 10⁵ PBMC/well stimulated with control antigen, CMV antigen, or SEB was analyzed. The lower panel shows IFN-γ secretion from CD8-depleted PBMC. The mean numbers of spot-forming units per well after stimulation with control antigen, CMV antigen, and SEB were 23, ≫500, and >>500 (upper panel) and 19, ≫500, and 404 (lower panel), respectively. Given the percentage of 52% CD4 T cells among CD8-depleted PBMC, 404 spots correspond to an SEB-reactive CD4 T-cell frequency of 0.4%. Thus, the ELISPOT assay leads to an approximately sevenfold underestimation of frequencies compared to the respective frequencies obtained by flow cytometry (A) 2.85%). (C) PBMC were stimulated with control antigen (o), CMV antigen (•), and SEB (▪), and proliferative responses were assayed after 1, 2, 3, 4, or 5 days. The left diagram corresponds to the individual analyzed in panels A and B, and the middle and right panels represent proliferative responses in individuals with CMV-specific CD4 T-cell frequencies of 2.9 and 0%, respectively.

