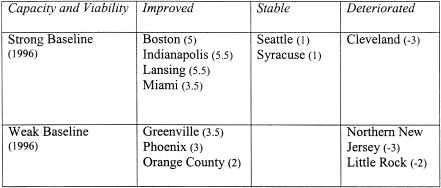
Figure 1.
A Snapshot of Safety Net Capacity and Viability Change, 1996—2001
Note: The number in parentheses after each site name refers to the net score to represent the degree of change in capacity and viability. In each community, the significant changes were assigned a score between –2 to +2, depending on whether the change was positive or negative and its relative significance. Scoring was contingent on the relative size of the provider, relative amount of money involved, or the potential number of uninsured individuals affected by the change. The net score for each community ranged from –3 to +5.5. We classified sites with scores between –1 and +1 stable, those with scores less than –1 deteriorated, and those with scores greater than 1 improved.

