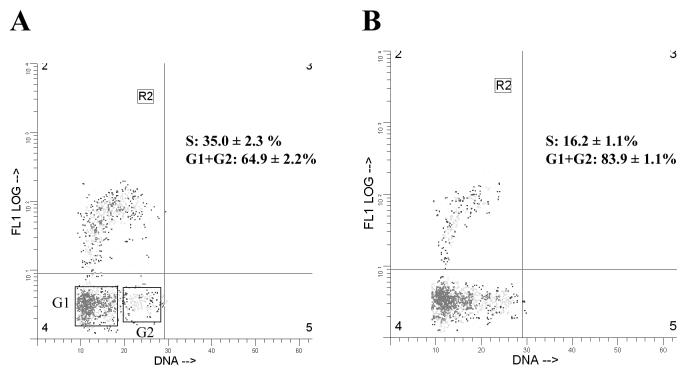
FIG. 7.
Bivariate DNA and BrdU distributions in BHK cells transduced with pBabe-Tax (A) and pBabe-puro (B), respectively. The ordinate shows the BrdU incorporation detected with FITC-labeled monoclonal antibody; the abscissa shows the total DNA content detected with PI. Relative nuclear DNA and BrdU levels were computed using the WinList program. Region R2 denotes the cell population in S phase. The G1 and G2 populations are also boxed.

