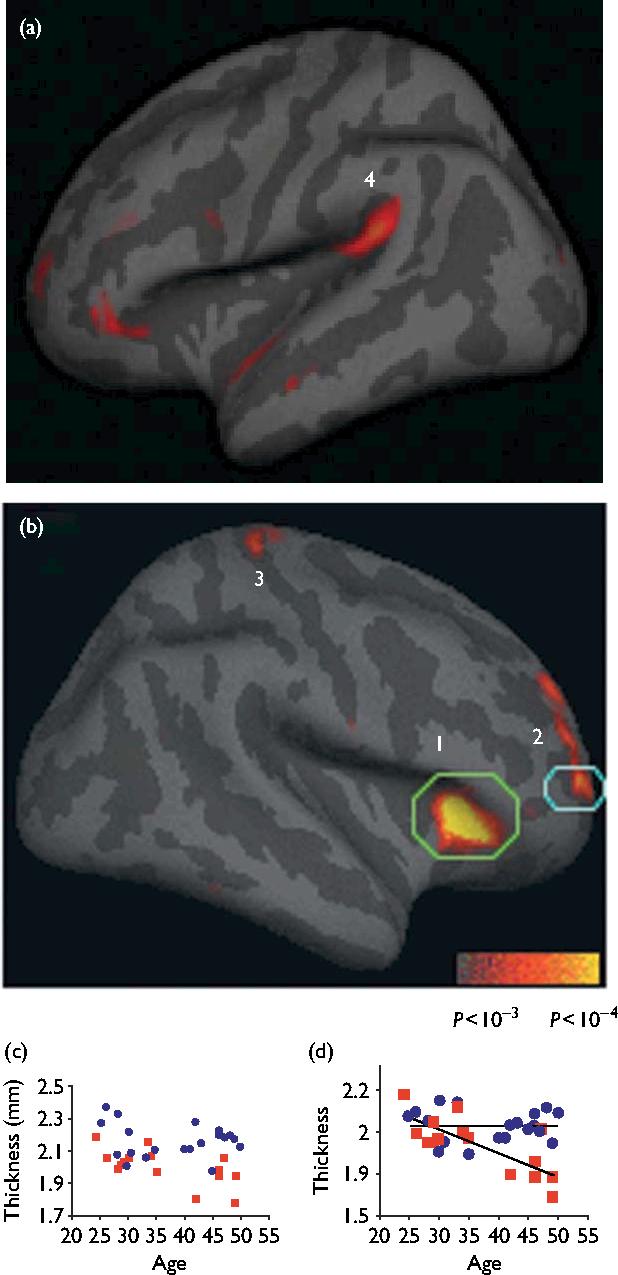
Fig. 1.

Cortical regions thicker in meditators than in controls. (a and b) Statistical map depicting between-group differences in thickness at each point on the cortical surface overlaid on the inflated average brain. All points meeting a P < 0.01 threshold (uncorrected) are displayed to better illustrate the anatomic extent of the areas and the relative specificity of the findings. Numbered regions: (1) insula, (2) Brodmann area (BA) 9/10, (3) somatosensory cortex, (4) auditory cortex. (c and d) Scatter plot of mean cortical thickness of each participant in the subregion above threshold within each circled region of (c) insula and (d) BA 9/10, plotted versus age. Meditation participants: blue circles; control participants: red squares.
