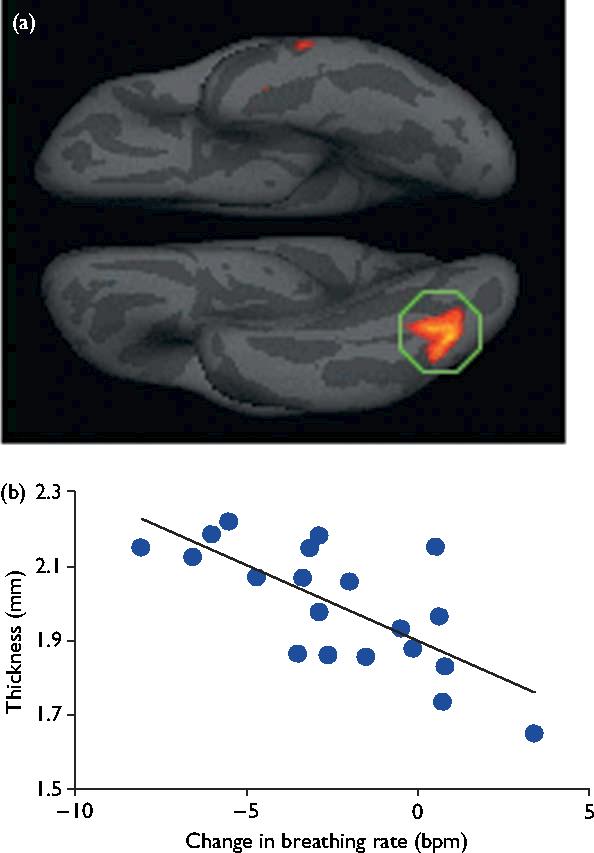
Fig. 2.

Visual area correlated with meditation experience. (a) Statistical map depicting cortical thickness correlated with change in respiration rate. (b) Scatter plot of mean cortical thickness of each participant from the circled region within the inferior occipitotemporal lobe plotted versus change in respiration rate. Note: negative change in breathing rate (left side) is associated with more hours of meditation experience and a thicker cortex.
