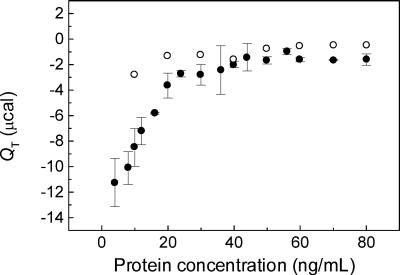
FIG. 3.
Binding isotherms. The total heat (QT) was calculated for each peak of the calorimetric thermograms resulting from the injection of VSV into vesicles (see Fig. 1). QT is plotted as a function of the protein concentration in each injection, with the mean ± standard error (SE) for five different experiments with PC-PS (•) and the mean of two experiments with PC-only vesicles (○) obtained with the same VSV preparation. The data were essentially the same for the PC-PS vesicles containing 25, 50, or 75% PS. The conditions were the same as in Fig. 1. Bar, 0.05 μcal s−1.

