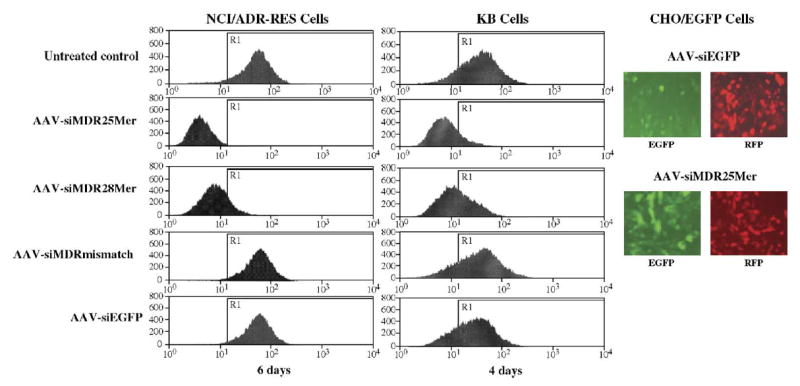
FIG. 1.

Inhibition of cell surface P-glycoprotein expression by scAAV-delivered siRNA. NCI/ADR-RES, KB-Cl, and CHO/EGFP cells were infected with the indicated scAAV vectors at 1200 particles/cell (with the exception of 5000 particles/cell for AAV-siMDR28mer) and cultured for 6 or 4 days. Cell surface P-glycoprotein expression was estimated by immunostaining and flow cytometry as described under Materials and Methods. On the right EGFP and RFP expression were examined by fluorescence microscopy. On the left the abscissa represents the relative fluorescence from an FITC-conjugated secondary antibody bound to the primary anti-P-glycoprotein antibody. The ordinate is the number of cells at each level of fluorescence. The line marked R1 is a value of the P-glycoprotein fluorescence 2 standard deviations below the mean of the peak of the untreated control.
