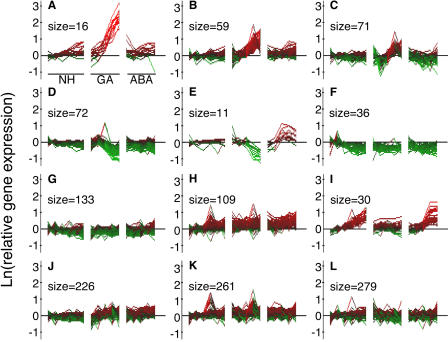
Figure 1.
Patterns of gene expression in a dataset containing 1,311 probe sets enriched for those that were GA responsive. The natural logarithm (ln) of probe set intensity at each time relative to the average intensity with no hormone (NH) at 0, 0.5, and 1 h is shown for each of the 16 microarrays used in this experiment. Samples were extracted from rice half-grains treated with NH for 0, 0.5, 1, 3, 6, and 8 h; GA for 0.5, 1, 3, 6, and 8 h; and ABA for 0.5, 1, 3, 6, and 8 h. Red indicates an increase in transcript abundance, and green indicates a decrease. The number of probe sets in each k-means cluster is indicated as its size.

