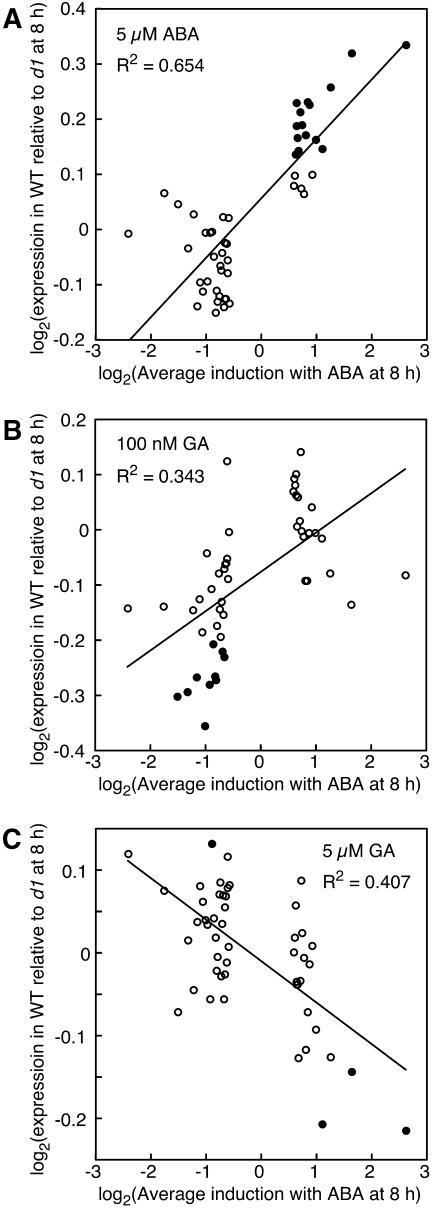
Figure 6.
Changes in RNA abundance for many genes that are up- or down-regulated with ABA are reduced in d1 mutant half-grains relative to wild type. Each point in A to C represents 25 probe sets, with the 25 probe sets having the highest induction with ABA at 8 h represented by the rightmost point and the 25 probe sets with the highest repression with ABA represented by the leftmost point. Black circles have an average expression ratio different from 1.0 at the level of P = 0.001. Note that the graphs in A to C are plotted on a log2-log2 scale.

