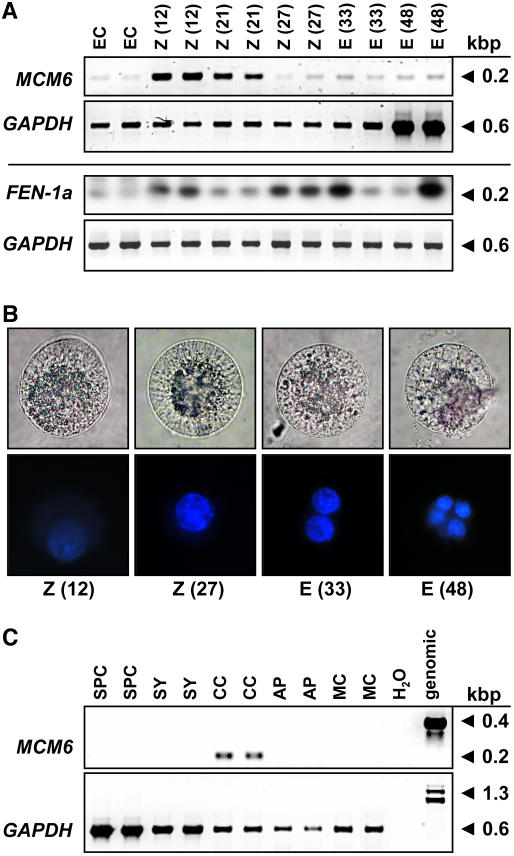
Figure 3.
Expression of ZmMCM6 in gametic cells before and after fertilization. A, SC RT-PCR of ZmMCM6 and ZmFEN-1a in egg cells (EC), zygotes (Z), and proembryos (E) at different time points after IVP. The numbers in parentheses indicate hours after pollination (fertilization occurs about 6 h after IVP; top row). Amplification of GAPDH from the same cells is shown for comparison in the corresponding bottom rows. Note that the cells for ZmMCM6 and for DAPI staining (B) were collected in winter and for ZmFEN-1a in summer. ZmFEN1a signals were intensified after blotting and hybridization with a gene-specific radioactive probe. B, Light (top row) and fluorescent images (bottom row) of DAPI-stained zygotes and proembryos. Time points after IVP are indicated. Cell size is about 60 μm. C, SC RT-PCR of ZmMCM6 in sperm cells (SPC), cells of the female gametophyte, including synergid (SY), central cell (CC), and antipodals (AP), as well as leaf mesophyll cell (MC) and controls (water and genomic). Amplification of GAPDH from the same samples is shown in the bottom row.

