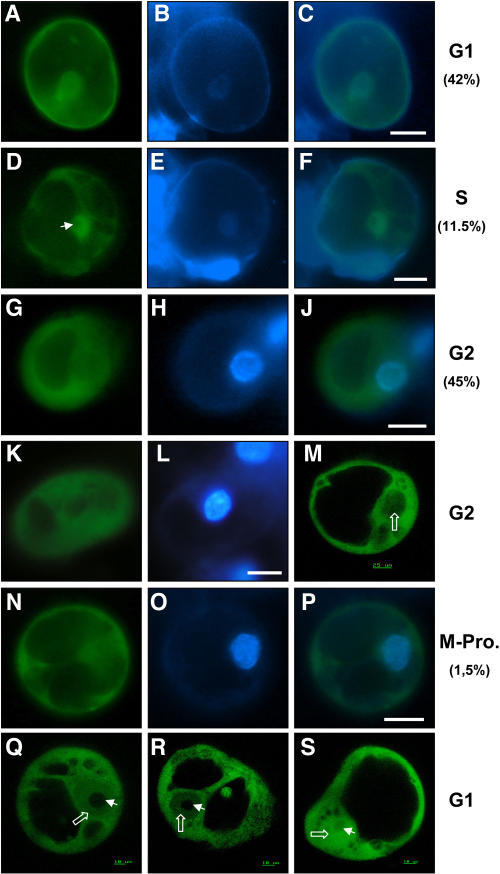
Figure 6.
ZmMCM6 shuttles between nucleus and cytoplasm in maize BMS suspension cells in a cell cycle-dependent manner. Suspension cells were transiently transformed with a UBIp:ZmMCM6-GFP construct and analyzed using epifluorescence microscopy (A–L and N–P) as well as CSLM (M, Q–S). Relative DNA content of cells was determined after DAPI staining. A, About 42% cells showed localization of the chimeric protein in both cytoplasm and nucleoplasm. B, DAPI staining of the cell shown in A to display the nucleus. C, Merged image of A and B showing similar DAPI signal in the nucleus compared to GFP fluorescence. These cells were counted for G1 phase. D, About 11.5% of the cells examined accumulated most of the chimeric protein in the nucleoplasm, but not in the nucleolus (arrowhead). E, DAPI staining of the cell shown in D. The image was enhanced to display the weak fluorescence of the nucleus in late G1/S phase. F, Merged image of D and E showing mainly GFP fluorescence in the nucleus. G and K, Majority of cells (about 45%) displayed GFP fluorescence only in the cytoplasm and lacked GFP signals in the nucleus. H and L, Strong DAPI staining of the nuclei of these cells revealed that they were in G2 phase. J, Merged image of G and H showing GFP fluorescence in the cytoplasm and DAPI fluorescence in the nucleus. M, Stack of five CLSM images of a cell in G2 phase confirms lack of GFP fluorescence in the nucleus (open white arrow). N, Cell showing GFP fluorescence exclusively in the cytoplasm displayed condensation of chromosomes (O) during prophase of mitosis. P, Merged image of N and O confirms lack of GFP fluorescence in the nucleus. Q and R, Gradient of the fusion protein between cytoplasm and nucleoplasm was observed in stacks of five images each of two different cells in G1 phase. The weak DAPI staining of these cells is not shown. Note that the chimeric protein is localized in both cytoplasm and nucleoplasm (open white arrows), but never in the nucleolus (arrowhead). S, Control showing a suspension cell bombarded with a UBIp:GFP construct showing GFP fluorescence in the nucleolus, nucleoplasm, and cytoplasm. The arrowhead points toward the nucleolus and the open arrow toward the nucleoplasm. Scale bars are 20 μm, unless otherwise indicated.

