Figure 7.
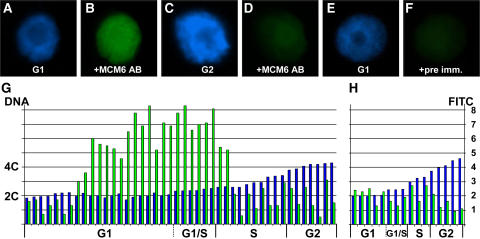
ZmMCM6 is taken up by the nucleus during G1 phase and highest protein levels are detectable during late G1/early S phase of the cell cycle. Relative DNA content of isolated BMS nuclei were determined after DAPI staining. ZmMCM6 protein amounts were measured after incubation with an FITC-coupled antibody against a ZmMCM6 peptide antibody. DAPI staining (A) and FITC signals (B) of a nucleus in G1; DAPI staining (C) and FITC signals (D) of a nucleus in G2; DAPI staining of a G1 phase nucleus (E) and the same nucleus after incubation with preimmune serum showing minor background signals (F). G, Summary of measurements of 44 nuclei. After DAPI measurements, nuclei were classified as G1 (2C ± 15%), G1/S (2C + 16%–25%), S (2C + 26%–84%), and as G2 (4C ± 15%). Histograms show relative DNA (blue bar) and FITC (green bar) levels of individual nuclei. Relative DNA content is indicated at the left and relative FITC signal intensity at the right of image H. H, To show antibody specificity and to determine background signals, nuclei have been incubated with preimmune serum. Classification of nuclei was as described in G.

