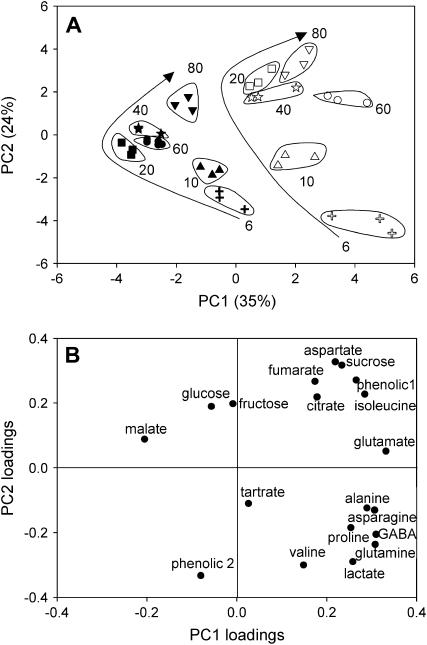
Figure 6.
PC analysis on 1H-NMR data (absolute quantification of 19 compounds from the flb mutant and the wild type for extracts at six stages of berry development). A, Scores obtained on PC1 and PC2 for the wild type (black symbols) and the mutant (white symbols). Arrows represent changes during berry development. Individual values are given for each biological triplicate. Each number corresponds to DAA. B, PC1 and PC2 loadings for each analyzed compound.

