Figure 1.
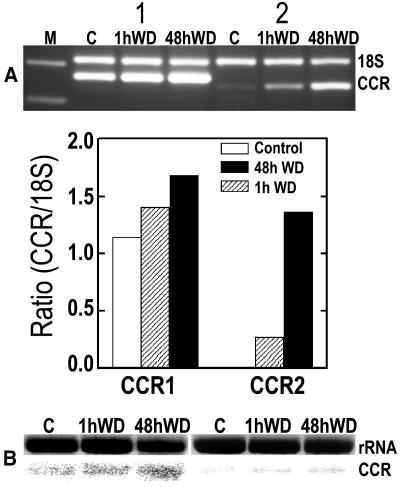
Water deficit (WD) for 1 and 48 h increases the transcript levels of CCR genes in the root elongation zone as compared with well-watered controls (C). A, Relative RT-PCR analyses; lane M shows markers of 200 and 300 bp; 18S indicates a 315-bp fragment of 18S ribosomal RNA used as the internal standard; first three lanes after marker lane are for CCR1 amplicon (263 bp); next three lanes are for CCR2 amplicon (242 bp). The bar graph shows the progressive increases in ratio-corrected (by comparison with 18S RNA) pixel densities for each PCR product after 1 or 48 h of water deficit. Ratio value for CCR2 control is too small to appear. B, Similar water deficit-induced increases in CCR1 and CCR2 transcript levels shown by RNA gel-blot hybridization analysis.

