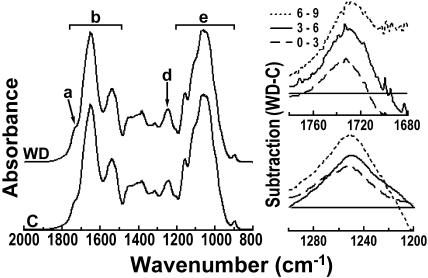
Figure 2.
FTIR absorbance differences between cell walls from water deficit-treated and control roots at increasing distances from tip. Left-hand figure shows average FTIR absorbance spectra over the 2,000 to 800 cm−1 range for cell walls of control roots (C) and roots under water deficit (WD) from the region 6 to 9 mm behind the root tip. The spectra were baseline corrected and area normalized. The arrow (a) marks a shoulder in the 1,740 to 1,720 cm−1 region, which is indicative for alkyl and phenyl esters. Horizontal bar (b) emphasizes major bands indicative of amide I and amide II. The arrow (d) points to absorbance around 1,245 cm−1, which is indicative of C-O-H deformation and C-O stretching of phenols plus asymmetric C-C-O stretching of esters (Séné et al., 1994). The bar (e) indicates carbohydrate absorbance bands. Mean spectra based on separate assays of six batches of roots. Difference spectra on the right side of the figure were generated by digital subtraction of the spectral absorbance values of control root cell wall preparations between 1,780 and 1,680 cm−1 (in top figure) and between 1,200 and 1,300 cm−1 (in bottom figure) from corresponding absorbance values for walls of water deficit-treated roots. Key in top right-hand figure differentiates the subtraction plots for cell walls from 0 to 3, 3 to 6, and 6 to 9 mm behind the tip. Note progressive increases induced by water deficit in phenol-related absorbance at 1,720 to 1,740 cm−1 and at 1,245 cm−1 as distances from tip increase. No further increases were measured at 9 to 12 mm from tip. Horizontal lines represent zero difference between treatments at indicated wave numbers along the x axis.

