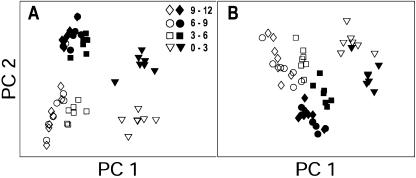
Figure 3.
Exploratory PCA confirms stress-induced differences between cell wall FTIR spectra. PCA scores of spectra in the apical region of control and water-stressed roots at 1,800 to 1,600 cm−1 (A) and at 1,260 to 1,220 cm−1 (B). At these wave numbers, consistent separations are evident between cell wall samples from control (white symbols) and water deficit treatment (black symbols) at all distances from tip.

