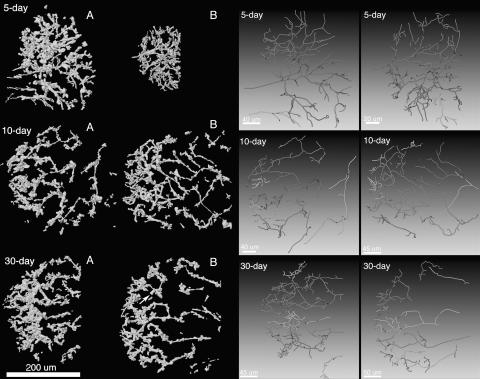
Figure 2.
Reconstructed IT networks and network skeletons. The left half of the figure shows the six 3-D reconstructions used in this article. A and B, Nodules as presented in Table I. The arrow in the image of the 30-d-old nodule shows the infection droplet displayed in Supplemental Figure 1. The right half of the figure shows the centerlines for IT subtrees that contained two or more branches. Shades of gray are used to help visually separate overlapping subtrees. The order of the networks is the same on both sides of the figure.

