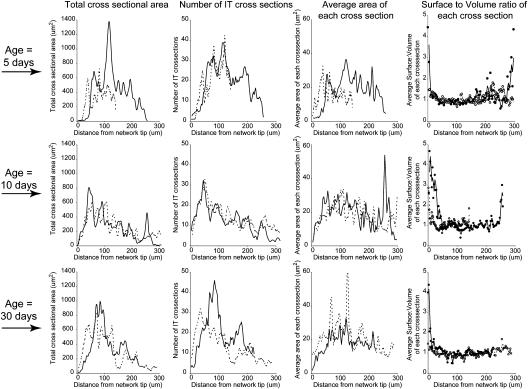
Figure 5.
Size of ITs and IT networks. Three-dimensional representations of IT networks were sampled by extracting 100 evenly spaced cross-sectional slices from the apexes of the networks to their bases. Cross sections were oriented perpendicular to the long axis of the nodules. Total IT area per slice, average number of IT cross sections per slice, average area of each IT cross section in each slice, and the average surface-to-volume ratio of each IT cross section in the slice, assuming a slice thickness of 0.1 μm, are shown. Top, middle, and bottom rows show data from 5-, 10-, and 30-d-old nodules, respectively.

