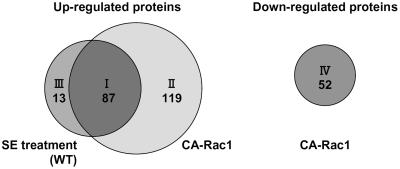
Figure 4.
Four categories of proteins identified by the proteome analysis of CA-OsRac1-expressing cells and wild-type cells treated with SE. Proteins grouped in class I (87 proteins; Table I) were those increased by both CA-OsRac1 and SE treatment. Class II (119 proteins; Supplemental Table I) includes proteins that were up-regulated by CA-OsRac1 but not increased by SE treatment. Class III (13 proteins; Supplemental Table II) includes those that were induced by SE treatment but not induced by CA-OsRac1. Class IV (52 proteins; Supplemental Table III) includes those whose expression levels were decreased by CA-OsRac1.

