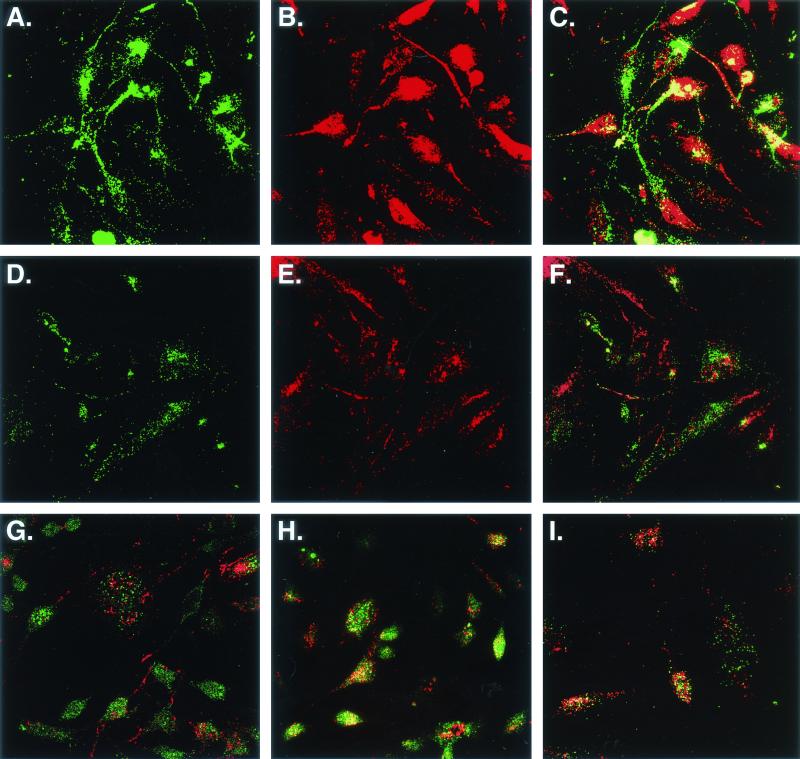
FIG. 3.
Colocalization of EBO-Z and MBG pseudotypes with the caveola protein marker CAV-1 after infection of HeLa cells. (A to I) Images of cells with Ctxn B-FITC (A to C), tfn-FITC (D to F), and the VSV, EBO-Z, and MBG pseudotypes (G, H, and I, respectively); (C) Ctxn B-FITC and CAV-1 colocalization following incubation of cells with Ctxn B-FITC for 30 min at 37°C; (F) absence of colocalization of tfn-FITC and CAV-1 following incubation of cells with tfn-FITC for 30 min at 37°C; (G) absence of colocalization of VSV and CAV-1 following incubation of cells with VSV pseudotypes for 30 min at 37°C; (H and I) colocalization of EBO-Z and MBG with CAV-1 following a 90-min incubation of cells with EBO-Z (H) and MBG (I) pseudotypes at 37°C. Following the incubations, all samples were fixed in paraformaldehyde (2%), permeabilized in Triton X-100 (0.1%), and immunostained for p24 (to detect pseudotypes) and/or CAV-1 (to detect caveolae). p24 was detected with an FITC-conjugated mouse anti-p24 antibody (Coulter Corp.), and the FITC signal was amplified with Alexa sandwich antibodies (Alexa Fluor 488-conjugated goat polyclonal anti-FITC antibody and Alexa Fluor 488-conjugated donkey anti-goat IgG (H+L) conjugate (Molecular Probes, Inc.). CAV-1 was detected with a rabbit polyclonal antibody against CAV-1 (BD Transduction Laboratories) and a Texas Red-conjugated anti-rabbit IgG (H+L) F(ab′)2 fragment (Jackson ImmunoResearch Laboratories, Inc.). Cell images were taken under oil at a ×60 magnification with a Bio-Rad Radiance2100 laser scanning confocal microscope system operated via LaserSharp2000 software. For intracellular analyses of cells, the z-axis position was computer controlled and the basal and apical membranes were set as the start and stop points, respectively. All images were at least 2 μm from either vantage point. Immunostained cells were excited with krypton or argon lasers at 488 nm (Alexa Fluor 488 and FITC) and 568 nm (Texas Red), and fluorescence signals were collected with barrier filters for Alexa Fluor 488 and FITC and for Texas Red. Regions of colocalization were generated by digital overlay with Photoshop 6 (Adobe Systems) and appear yellow (C and F to I). For comparison purposes, images collected with green and red barrier filters were digitally colorized to green (A and D) and red (B and E), respectively, also with Photoshop 6.

