Figure 5.
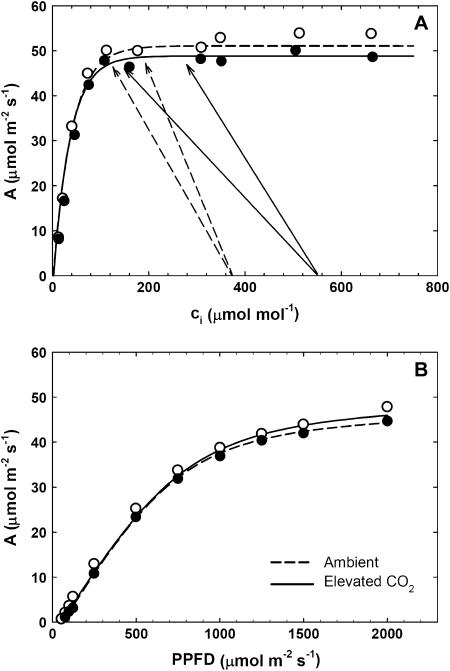
Photosynthetic gas-exchange analysis of the youngest fully expanded leaf of maize growing under ambient (○) and elevated CO2 (•). A, Representative A/ci curves fitted with model equations for C4 photosynthesis (von Caemmerer, 2000) of maize grown at ambient (dashed) and elevated [CO2] (solid). Arrows indicate the range of ci measured at midday during in situ measurements of maize grown at ambient (dashed) and elevated [CO2] (solid). There was no significant CO2 effect on Vpmax (DOY 180: ambient 139 ± 16, elevated [CO2] 122 ± 13; DOY 212: ambient 109 ± 3, elevated [CO2] 112 ± 5) or Vpr (DOY 180: ambient 51.2 ± 1.8, elevated [CO2] 48.6 ± 1.2; DOY 212: ambient 44.0 ± 4.6, elevated [CO2] 40.1 ± 3.0). B, Representative A/Q curves fitted with nonrectangular hyperbolas for maize grown at ambient (dashed) and elevated CO2 (solid). There was no significant CO2 effect on maximum apparent quantum yield of photosynthesis (DOY 180: ambient 0.07 ± 0.01, elevated [CO2] 0.07 ± 0.01) or Asat (DOY 180: ambient 58.9 ± 1.3, elevated [CO2] 60.8 ± 1.4).

