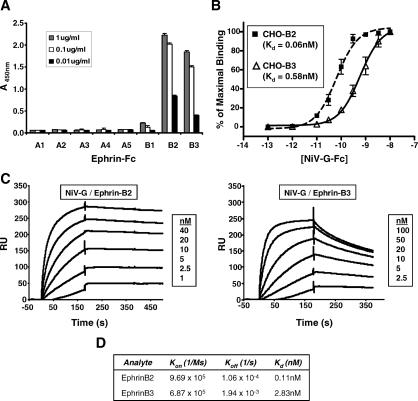
Figure 1. Soluble NiV-G Binds to EphrinB3 with Lower Affinity than EphrinB2.
(A) 1.0 μg/ml, 0.1 μg/ml, and 0.01 μg/ml of the indicated ephrin-Fc fusion proteins were allowed to bind to soluble NiV-G-coated plates in an ELISA format (see Materials and Methods). The amount of ligand bound was detected colorimetrically using an antihuman Fc antibody conjugated to horseradish peroxidase. One representative experiment out of three is shown. Data are averages of triplicates ± standard error (SE).
(B) EphrinB2 and B3 stably transfected CHO-pgsA745 cells (CHO-B2 and CHO-B3, respectively) were used to measure NiV-G-Fc cell surface binding. Increasing concentrations of NiV-G-Fc were added to either CHO-B2 cells (dashed line with squares) or CHO-B3 cells (solid line with triangles), and binding was assessed by flow cytometry using R-phycoerythrin-conjugated anti-Fc antibodies. Regression curves were generated as described in Materials and Methods. Each data point is an average ± SE from three experiments.
(C) Surface plasmon resonance (BIAcore 3000) measured the binding kinetics of NiV-G-Fc to both ephrinB2-Fc and ephrinB3-Fc in response units (RU). NiV-G-Fc was immobilized to a CM5 sensor chip via an amide coupling procedure, and increasing concentrations of ephrinB2-Fc and ephrinB3-Fc were flowed as analyte over the sensor chip. One representative experiment out of two is shown.
(D) K d, K on (association-rate), and K off (dissociation-rate) were determined by fitting the binding chromatogram data from (C) with BIAcore evaluation software (version 3.1) using the 1:1 Langmuir binding model.

