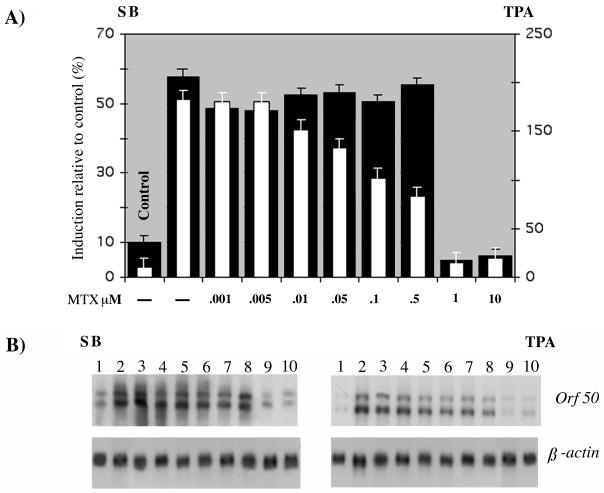
FIG. 1.
(A) MTX dose-response curve on ORF50/Rta mRNA levels in BC-3 cells induced with TPA and sodium butyrate (SB). Hybridization was performed with an ORF50/Rta probe. Bars indicate the values for BC-3 cells treated with MTX and induced with sodium butyrate (solid bars) or TPA (open bars). Control indicates the value for uninduced and untreated BC-3 cells. (B) Northern blots.

