
Figure 2.
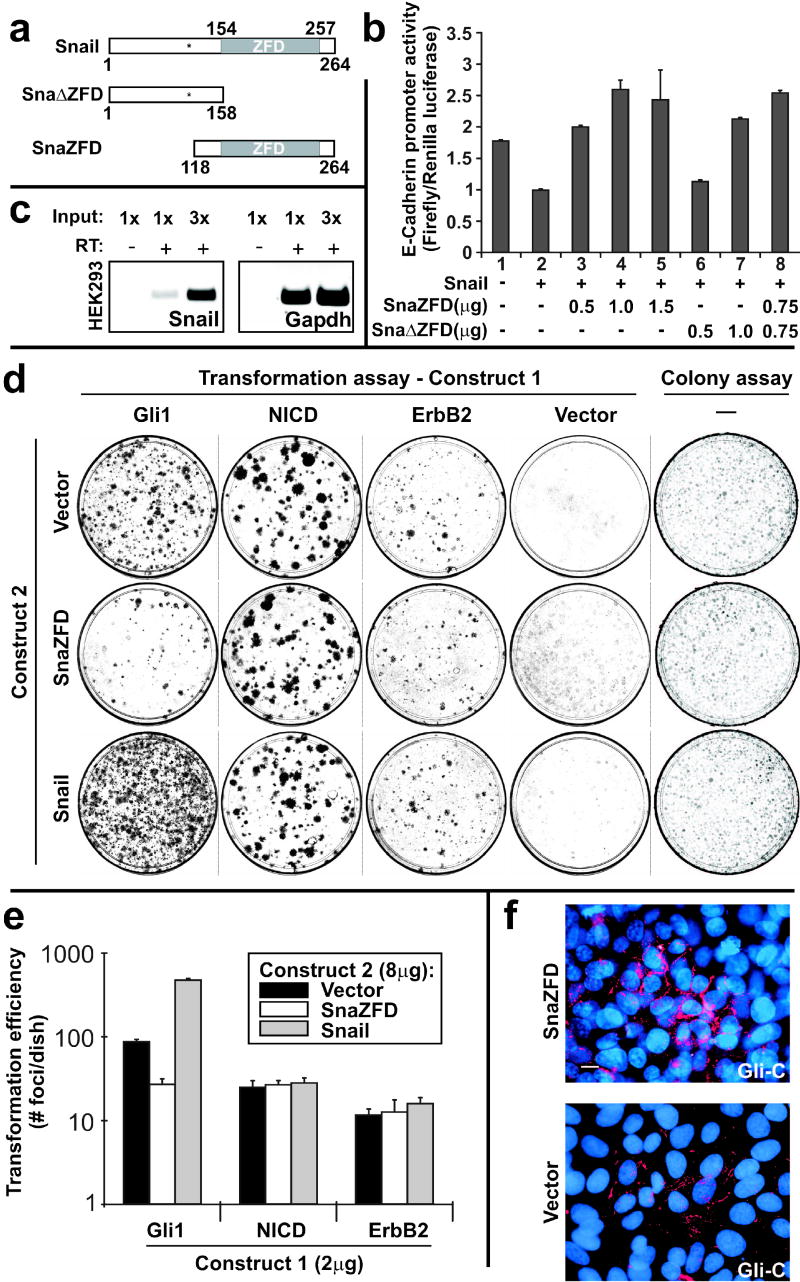
Characterization of dominant negative alleles of Snail. (a) Schematic of wild type mouse Snail, Sna ZFD and SnaZFD. The approximate position of GSK3β phosphorylation sites is indicated (asterisk) (Zhou et al., 2004; Yook et al., 2005). (b) Truncated Snail alleles were analyzed for interference with Snail-mediated repression of E-cadherin promoter activity. Plasmids were transfected into HEK293 cells, and cell extracts were analyzed using the Dual Luciferase Reporter Assay. Three experiments were performed in triplicate and standard error bars are shown. (c) Endogenous Snail in HEK293 cells was detected by RT-PCR. No product was detected without addition of RT. (d) Snail and SnaZFD were analyzed for modulation of oncogene transforming activity by lipofectamine-mediated co-transfection of the indicated plasmids (Construct 1, Construct 2) into RK3E cells. Wright-stained petri dishes contained foci of transformed cells on a monolayer of untransformed RK3E (Transformation assay, columns 1–4), or else colonies of puromycin-resistant cells that survived 7 days in selective culture media (Colony assay, column 5). (e) Transformation efficiency was plotted on a log10 scale. Results for Gli1 represent 3 independent experiments performed in triplicate, and standard error bars are shown. Results for NICD and ErbB2 represent one experiment performed in triplicate, and standard deviation bars are shown. (f) Gli-C cells were electroporated with the indicated expression plasmid. A GFP control vector indicated successful transfection of nearly all cells (not shown). E-cadherin expression (red) was visualized 48 hrs post-transfection by indirect immunofluorescence. Nuclei were stained with DAPI (blue). Scale bar, 10μ.