
Figure 8.
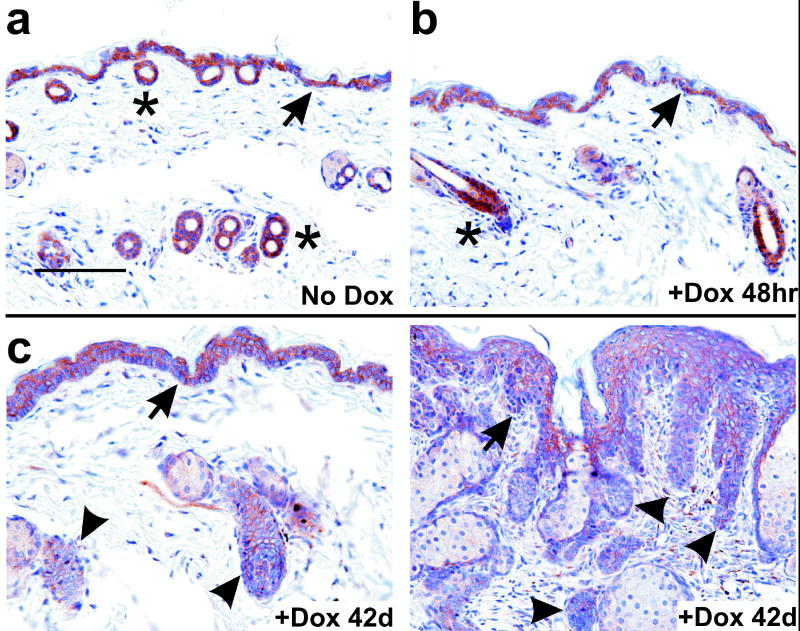
Analysis of E-cadherin expression during Gli1-induced neoplastic progression. (a–c) K14-rtTA;TRE-Gli1 mice were induced with dox for the indicated interval. Sections of skin corresponding to no treatment (No Dox); t=6, 12, or 24 hr; or t=42 days were stained in parallel with antibody to E-cadherin. Staining is indicated by a brown precipitate. (c) At 42d, adjacent areas from a single tissue section are shown, corresponding to less involved skin (left panel) or more involved skin (right panel). Arrowheads indicate epithelium with reduced staining. No signal was observed using as control a normal mouse IgG at the same concentration (not shown). Asterisks indicate hair follicles, and arrows indicate the DEJ. Scale bar, 100μ.