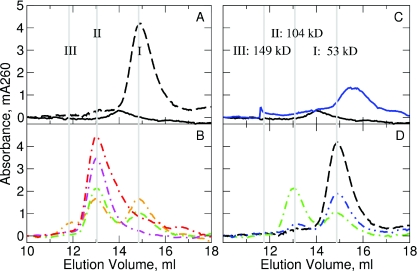
Figure 3.
Gel-filtration of M.RsrI–DNA complexes. Elution profiles at 260 nm are: (A) native M.RsrI (solid black) and DNA (dashed black) alone; (B) native M.RsrI–DNA complexes (dash-dot lines) with protein:DNA ratios of 0.5:1 (orange), 1:1 (green), 2:1(magenta) and 4:1 (red); (C) S124D M.RsrI (solid blue) and native M.RsrI (solid black) alone; (D) 1:1 complexes of S124D M.RsrI–DNA (blue dash-dot-dot), native M.RsrI–DNA (green dash-dot) and DNA (dashed black) alone. Elution peaks were marked with gray lines, labeled I, II and III with their corresponding molecular weight in (C).

