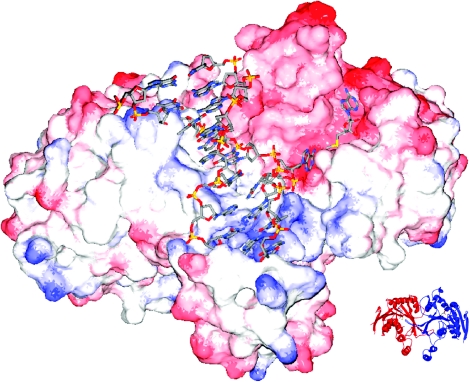
Figure 7.
RsrI MTase dimer modeled with bound DNA. The model was created by superimposing the β-strand cores of RsrI MTase and the M.TaqI-DNA structures. M.RsrI is shown as a charged surface from red (negative) to blue (positive). The DNA is from the M.TaqI structure and shown as sticks colored by atom type (red = O, blue = N, yellow = P, gray = C). AdoMet bound to M.RsrI is also shown as sticks colored similar to the DNA except that yellow = S. A ribbon diagram of the orientation of the protein dimer alone is shown in the inset. The figure was created using Swiss PDB Viewer (34) and POV-RAY (www.povray.org).

