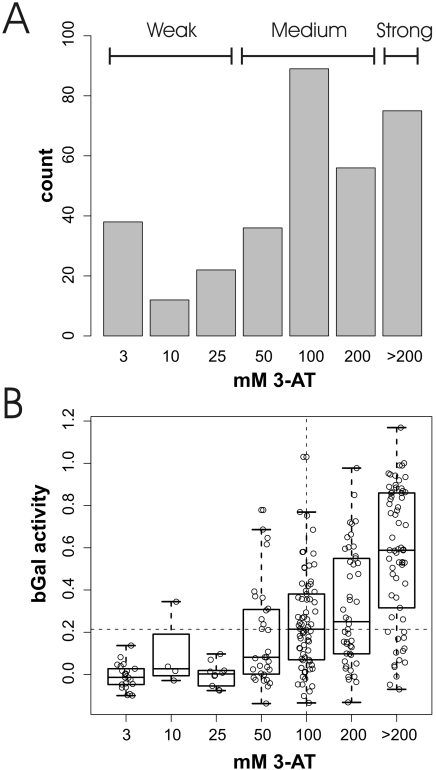
Figure 1.
Activation strength in Y2H activators. (A) Number of activators showing the indicated activation strength in the LTH assay. They were divided into weak (LTHw), medium (LTHm) and strong (LTHs) activators as indicated. (B) Correlation of activation strength in LTH and bGal assays. The actually measured values are shown as dots, the median and two quartiles by an overlayed boxplot. Dotted lines indicate the median of bGal activity and LTH activity, respectively. For an explanation of datasets see Table 1.

