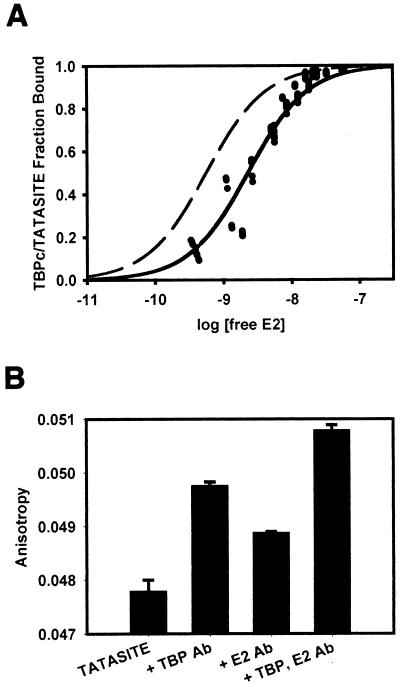
FIG. 4.
Association of HPV-11 E2 with TBPc-TATASITE. (A) E2 was titrated onto 1 nM TBPc-TATASITE in titration buffer as described in Materials and Methods. The fluorescence anisotropy of the solution was determined after each addition of E2. The data behaved as a single class of noninteracting E2 binding sites. Using the observed fluorescence anisotropies of the free and bound TBPc-TATASITE, the fraction of TBPc-TATASITE bound to E2 was calculated. The data were fit to the Michaelis-Menton equation using a Newton-Gauss iterative least-squares regression analysis assuming a single class of noninteracting E2 binding sites (SigmaPlot). The fraction of TBPc-TATASITE bound by E2 was plotted as a function of the log of the free E2 concentration. The binding curve shown corresponds to an E2-TBPc-TATASITE Kd of 2.3 nM (r2= 0.96). A theoretical curve (dashed line) corresponding to a Kd of 0.56 nM (r2 = 0.58 with this data) is illustrated. (B) Upon saturation of TBPc-TATASITE with E2, rabbit polyclonal anti-TBP and rabbit polyclonal anti-E2 antibodies were added. The fluorescence anisotropy of the solutions was determined for each antibody separately and combined. The addition of each antibody resulted in statistically significant anisotropy increases, confirming that fluorescence anisotropy is affected by the presence of each protein. The anisotropy measurement from adding both antibodies was cumulative and significant, showing the presence of both TBPc and E2 on TATASITE.

