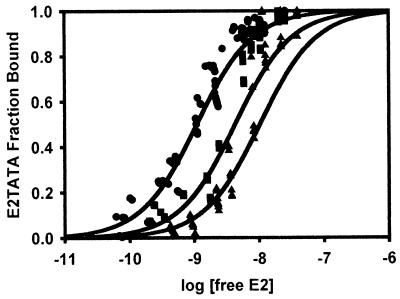
FIG. 5.
Association of HPV-11 E2 with E2TATA in the presence and absence of excess TBPc. E2 was titrated into 1 nM E2TATA in titration buffer, and the fluorescence anisotropy of the solution was determined after each addition of E2 as described in Materials and Methods. For titrations in the presence of TBPc, a final concentration of 2 or 4 nM TBPc was added prior to the addition of E2. Using the observed fluorescence anisotropies of the free and bound oligonucleotide, the fraction of oligonucleotide bound to E2 could be calculated as described in Materials and Methods. The fraction of E2TATA bound by E2 was then plotted as a function of the log of the free E2 concentration as described in Fig. 4. The binding curves shown correspond to E2-E1E2TATA Kds of 1.1 nM (no TBPc, circles; r2 = 0.96), 4.3 nM (with 2 nM TBPc, squares; r2 = 0.99), and 10.3 nM (with 4 nM TBPc, triangles; r2 = 0.96), respectively. The Ki of TBPc was determined to be 0.5 ± 0.1 nM.

