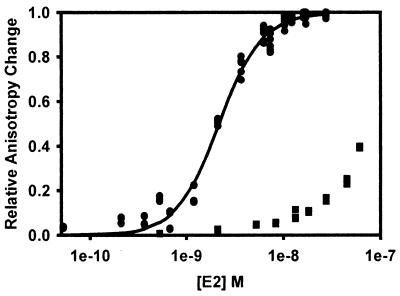
FIG. 6.
Association of HPV-11 E2 with E1E2TATA in the presence and absence of excess HPV-11 E1. E1E2TATA (1nM) in titration buffer was titrated with E2. For titrations in the presence of E1, a final concentration of 10 nM E1 was added prior to titration with E2. Data were collected and analyzed as described above. Since the E2-E1E2TATA interaction did not reach saturation, the data were not fit to a curve, and the [E2]0.5 (≈Kd) could only be estimated. The E1-E2-E1E2TATA interaction was analyzed by Hill fit to examine cooperativity of E2 binding. Because E2 binds to two sites, the graph is expressed as total E2 concentration as a function of relative anisotropy change, experimental saturation being 1.0. The binding curves correspond to an [E2]0.5 bound of 2.1 nM with a Hill coefficient of 1.5 (with E1, circles; r2 = 0.99) and an [E2]0.5 bound of >150 nM (without E1, squares; estimated).

