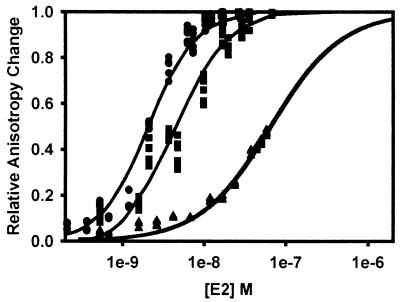
FIG. 7.
Association of HPV-11 E2 and HPV-11 E1 with E1E2TATA in the presence and absence of excess TBPc. One nanomolar E1E2TATA and 10 nM E1 in titration buffer were titrated with E2. In titrations with excess TBPc, a final concentration of 2 or 8 nM TBPc was added before titration with E2. Data were collected and analyzed as above. The binding curves correspond to apparent [E2]0.5 bound values (as defined above) of 2.1 nM (no TBPc, circles; Hill coefficient = 1.5; r2 = 0.99), 6.3 nM (with 2 nM TBPc, squares; Hill coefficient = 1.4; r2 = 0.98), and 65 nM (with 8 nM TBPc, triangles; r2= 0.98). The Ki of TBPc was determined to be 0.6 ± 0.3 nM.

