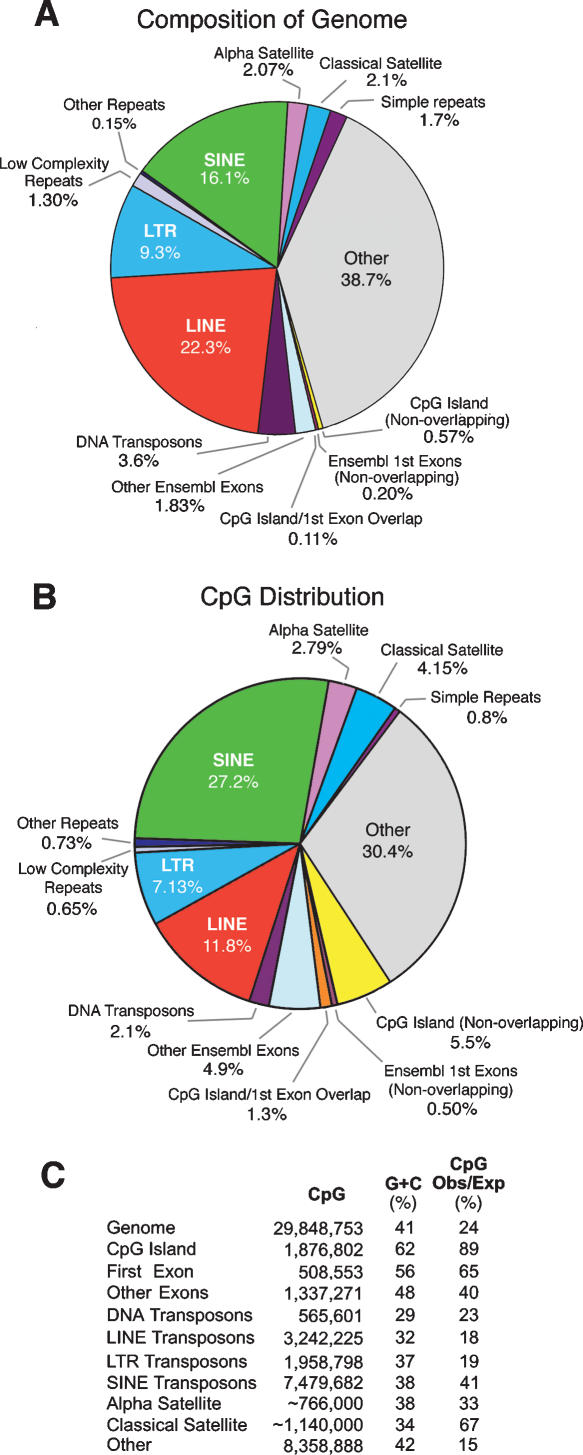
Figure 1.
Composition of the human genome and distribution of CpG sites. (A) Representation of sequence compartments in the human genome. (B) CpG content of the sequence compartments shown in A. (C) Total CpG numbers, G+C densities, and observed versus expected CpG frequencies for the compartments shown in A and B. The CpG island category included both first exon overlapping and nonoverlapping classes. Estimates of amount and CpG content of α and classical satellite DNA were from Eichler et al. (2004) and E.E. Eichler, pers. commun.

