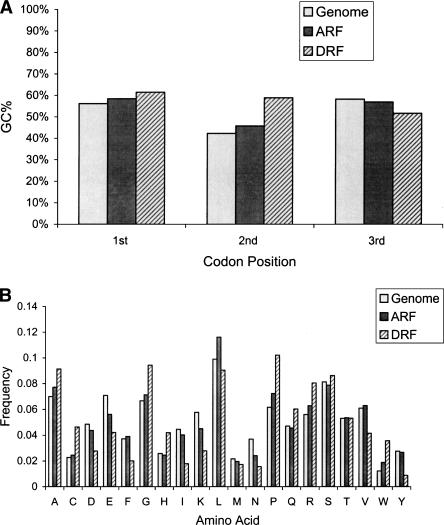
Figure 4.
(A) GC% at each codon position in dual coding regions. The gray bars represent GC% at each codon position in the whole-genome coding regions, the black bars represent GC% in ARFs, and the striped bars represent GC% in DRFs in dual coding regions. (B) Amino acid usage in dual coding regions. The gray bars represent the frequency of amino acids in the whole-genome coding regions, the black bars represent the frequency of amino acids in ARFs, and the striped bars represent the frequency of amino acids in DRFs in dual coding regions, (C) The correlation between amino acid usage and nucleotides at codon positions in DRFs in dual coding regions. The overrepresented amino acids are colored in blue, the underrepresented amino acids are colored in green, and the stop codons are in red. The statistically significantly overrepresented amino acids (Phe, Ile, Val, Tyr, Asn, Lys, Asp, and Glu) are colored dark blue (P <10-3); the statistically significantly underrepresented amino acids (Pro, Ala, His, Gln, Cys, Trp, Arg, and Gly) are colored dark green (P <10-3).


