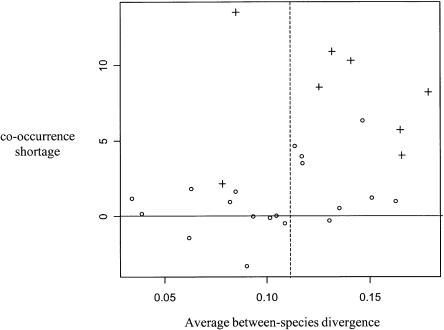
Figure 2.
Polymorphism co-occurrence vs. species divergence in 27 mammalian genera. Each symbol is for one polyspecific genus: x-axis, average cytochrome b sequence divergence between species (all three codon positions) in the genus; y-axis, difference between the observed number of synonymous polymorphism co-occurrences between species and the expected number under the constant mutation hot spots model; open circles, nonsignificant co-occurrence shortage; and crosses, significant co-occurrence shortage.

