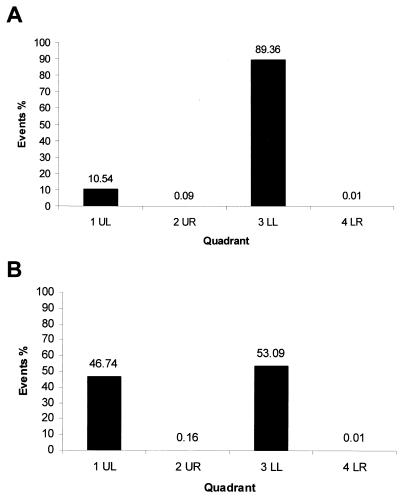
FIG. 11.
Histogram of Vero cells that stain with polyclonal antibody to IBV N protein conjugated to PE in mock-transfected cells (A) and in cells which express N protein (B) (1UL). 3LL denotes the number of untransfected cells. The proportion of apoptotic cells is shown in 4LR and apoptotic-necrotic cells in 2UR. (UL, LL, UR, and LR refer to the quadrants in the dot plot generated by the CellQuest software.)

