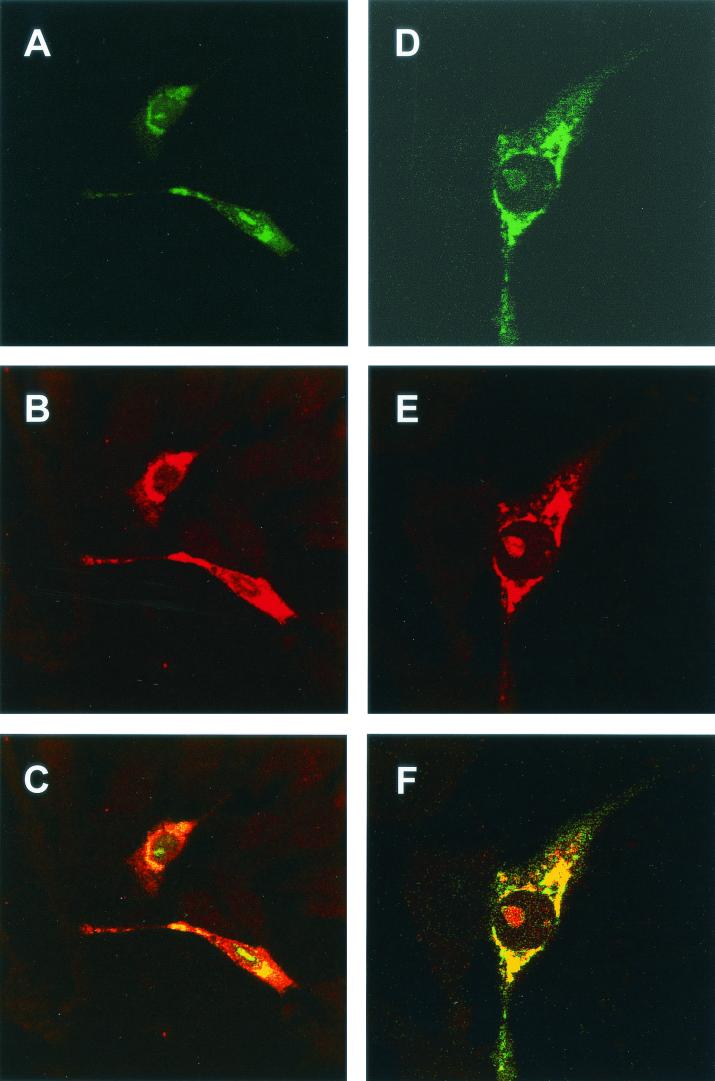
FIG. 6.
Vero cells were transfected with pFibrillarin-GFP and pCi-IBV-N, fixed, and analyzed by indirect immunofluorescence with rabbit anti-IBV (red) and direct fluorescence to visualize GFP. Differentially fluorescing images were gathered separately from the same 0.5-μm-thick optical section by using a confocal microscope and the appropriate filter. Two pairs of images (A+B and D+E) were digitally superimposed to depict the distribution of IBV N protein and fibrillarin-GFP fusion protein (C and F, respectively). Magnifications: ×60 (all panels) (zoom, ×2).

