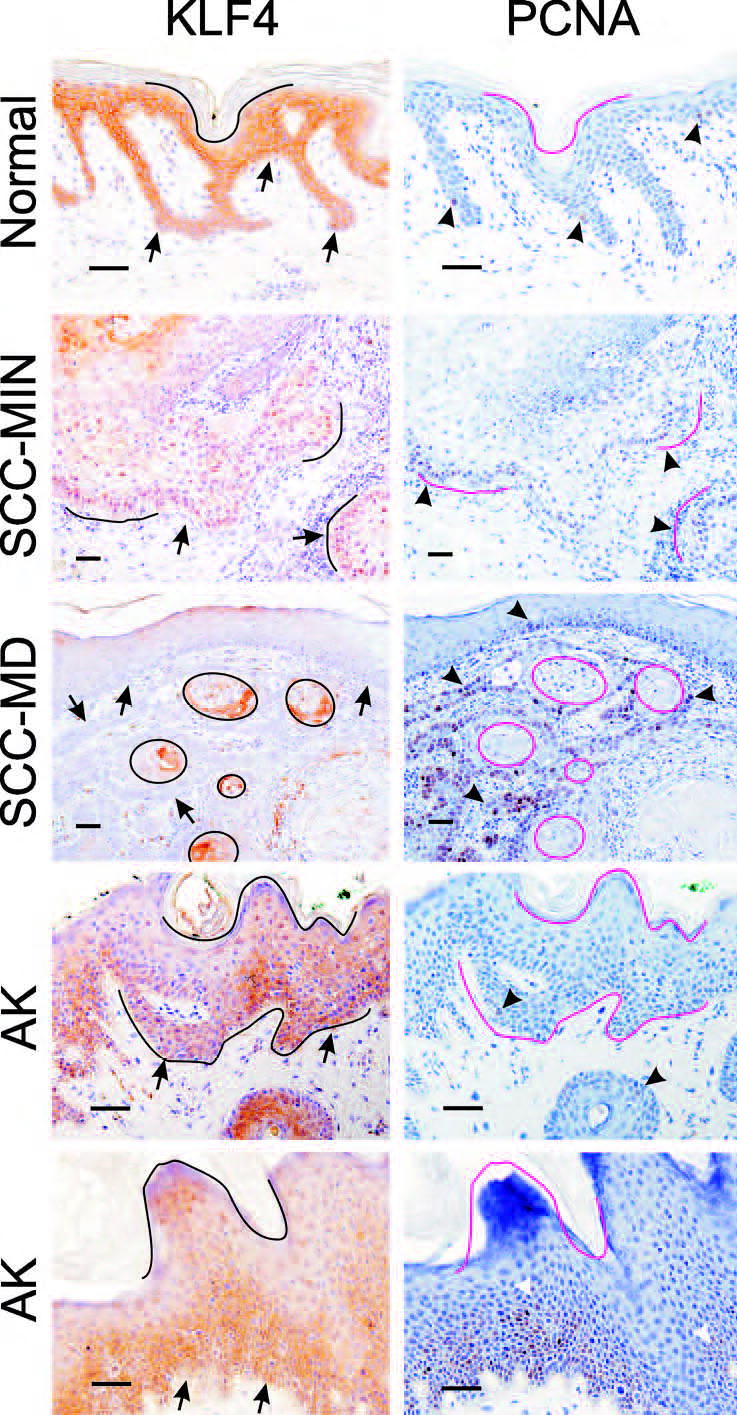
Fig. 6.

Co-localization of KLF4 and PCNA in human tissues. Serial sections of paraffin-embedded samples were analyzed by immunostaining. Identical orientation lines were placed on the matched images. Arrows indicate the DEJ or tumor-stromal borders, and arrowheads indicate examples of PCNA-positive cells. Scale bars, 50μ.
