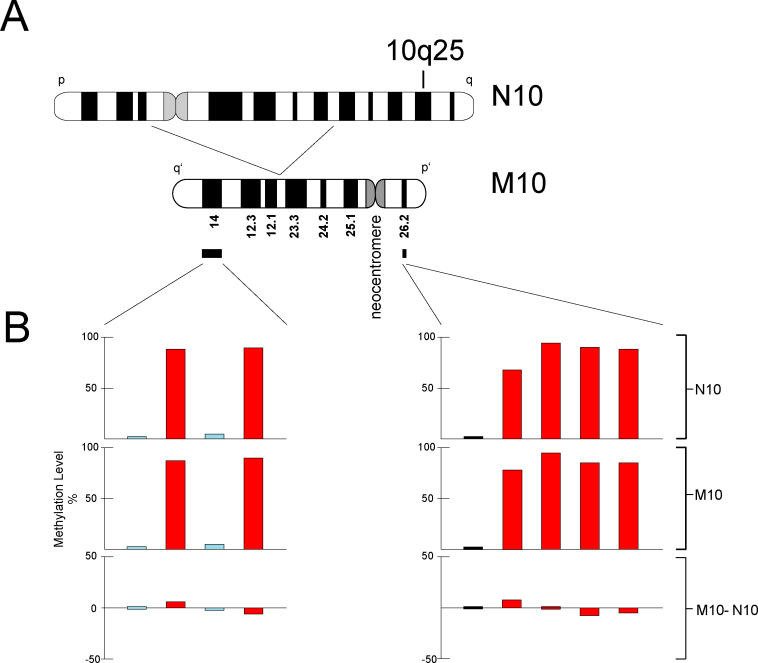
Figure 1. The 10q25 Locus and Control Regions Used in This Study.
(A) Chromosome ideogram representing the derivation of the M10 chromosome containing the neocentromere formed at the 10q25 band. CpG islands and CpG islets selected from the p14 and q26.2 bands situated 39 and 7 Mbp from the neocentric sites, respectively, were measured for methylation in both N10 and M10 cell lines.
(B) The level of methylation is shown for the same CpG islands and CpG islets in N10 and M10, and for their differences (M10 minus N10). CpG islands of >500 bp are represented by black bars; CpG islands of >200 bp and <500 bp are represented by light-blue bars; and CpG islets are represented by red bars.

