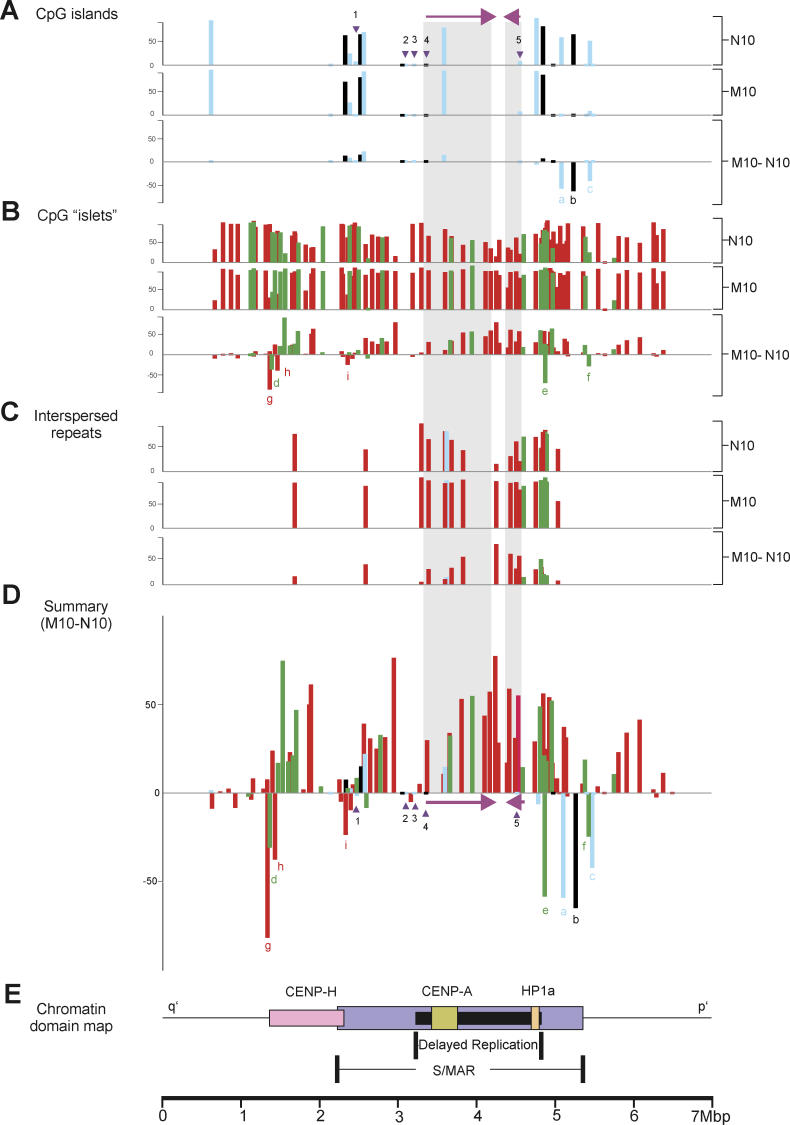
Figure 2. DNA-Methylation Profiles for 129 Separate CpG Islands and Islets.
Profiles apply across a 6.76-Mbp DNA section of the 10q25 region before (N10) and after (M10) neocentromere formation. The y-axis shows the percentage methylation in CHO–N10 and CHO–M10, and the percentage methylation difference (CHO–M10 minus CHO–N10).
(A) Classically defined CpG islands [15] are represented by blue bars, while CpG islands conforming to the modern definition [22] are identified by black bars. Genes previously shown to be expressed in both CHO–N10 and CHO–M10 and known to be associated with a 5′ CpG island are labeled (1) FLJ10188, (2) KIAA1600, (3) TRUB1, (4) ATRNL1, and (5) GFRA1, with the position of their 5′-associated CpG islands indicated by inverted triangles, and the direction of transcription and the full extent of the two larger genes (4 and 5) indicated by the horizontal arrows and shaded areas, respectively.
(B) CpG islets analyzed in this study with lengths ranging from 100 to 200 bp (green bars) or 50–99 bp (red bars).
(C) Methylation levels of CpG islets identified as retrotransposable and other interspersed repetitive elements analyzed in this study. The full extent of the two larger genes (4 and 5) is indicated by the shaded areas. The length of CpG islets ranges from 100 to 200 bp (green bars) or 50–99 bp (red bars).
(D) Summary of percentage methylation difference between CHO–M10 and CHO–N10. Three CpG islands and six CpG islets that are hypomethylated in M10 compared to N10 are denoted by a–i.
(E) Relative positions of previously described chromatin domains corresponding to foundation centromeric proteins CENP-H and CENP-A, heterochromatin protein HP-1α, and enhanced S/MAR regions [32], and a region of delayed DNA replication [30].

