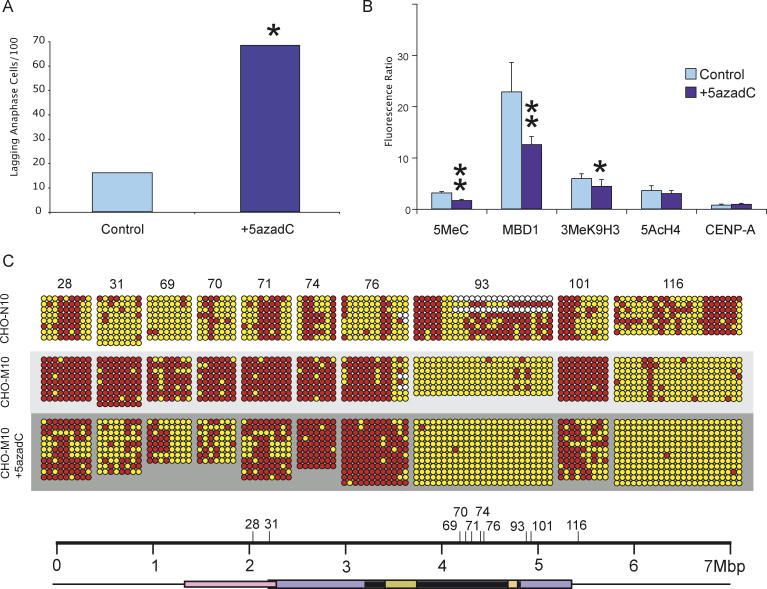
Figure 7. Effects of 20 μM 5-aza-dC Treatment on the 10q25 Neocentromere.
(A) Inhibition of DNA methylation with 5-aza-dC increases centromere instability as demonstrated by a significant increase in the proportion of anaphase cells containing lagging or bridging chromosomes when compared with non-drug-treated PBS control Asterisk indicates p < 0.001, χ2-test.
(B) Fluorescence-intensity ratio of chromatin proteins at the M10 neocentromere before and after 5-aza-dC treatment. The amount of 5MeC and MBD1, indicators of DNA methylation, was significantly reduced at the 10q25 neocentromere after 5-aza-dC. The histone modification, 3MeK9H3, associated with methylated DNA, also showed a significant reduction after 5-aza-dC treatment. Penta-acetylated H4, a histone modification associated with euchromatin, and constitutive centromeric protein A (CENP-A) were not significantly altered after 5-aza-dC treatment (mean raw fluorescence values are presented in Table S6). Single asterisk denotes p = 0.014, and double asterisks denote p < 0.001 in a Fisher's Exact t-test, with error bars representing standard errors of the mean.
(C) Determination of DNA-methylation level of eight CpG islets and two islands at the 10q25 neocentromere following 5-aza-dC treatment. Six CpG islets (28, 31, 69, 70, 71, and 101) showed an increase in DNA methylation upon the formation of the 10q25 neocentromere. However, following 5-aza-dC treatment, the methylation level of these CpG islets decreased significantly. The locations of the eight CpG islets and two CpG islands (numbers 93 and 116) with respect to the mapped centromere domains are depicted on the scale bar. The numbers for the CpG islands and islets correspond to those shown in Tables S2, S3, and S5.

