
Figure 2.
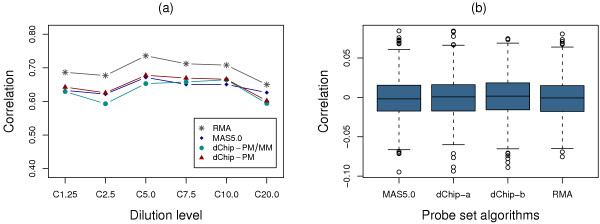
Correlation of RPSs for GeneLogic dataset. (a) Correlation of t-test statistics between RPSs for data from probe set algorithm RMA, MAS5.0, dChip-PM, and dChip-PM/PM at all 6 dilution levels (e.g. C10.0 stands for dilution level 10.0). (b) The distributions of the correlation coefficients from 1,000 simulated datasets with random t-test statistic pairs for data from each probe set algorithm. The results from dilution level 7.5 are shown. Correlation coefficients for all data from RMA, MAS5.0, dChip-PM (dChip-a) and dChip-PM/PM (dChip-b) are centered at zero.