
Figure 5.
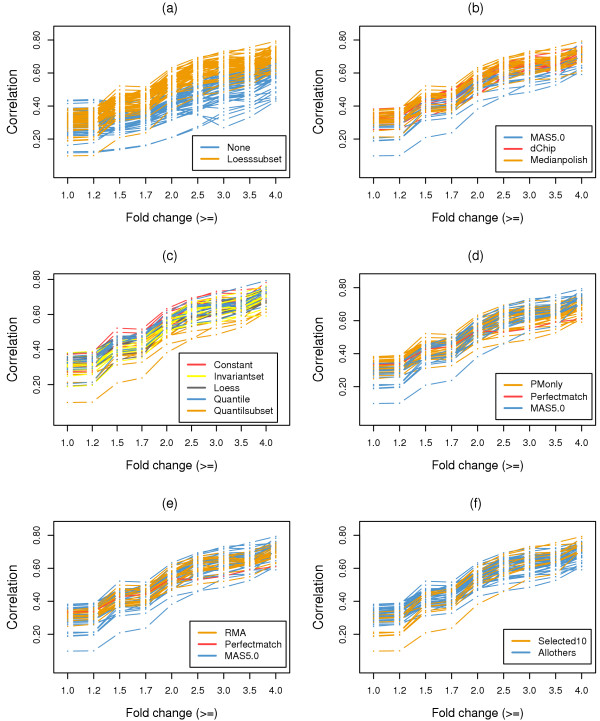
Correlation of RPSs results for the wholly defined control dataset. Correlation of t-test statistics between RPSs for expression summary datasets generated from combinations of options utilizing different probe set algorithms. The same analysis procedures as in Figure 4 were applied. (a) Comparison of normalization options at the probe set level. (b) Comparison of expression summary options. (c) Comparison of normalization options. (d) Comparison of PM correction options. (e) Comparison of background correction options. (f) Comparison of the selected 10 expression summary datasets to all others.