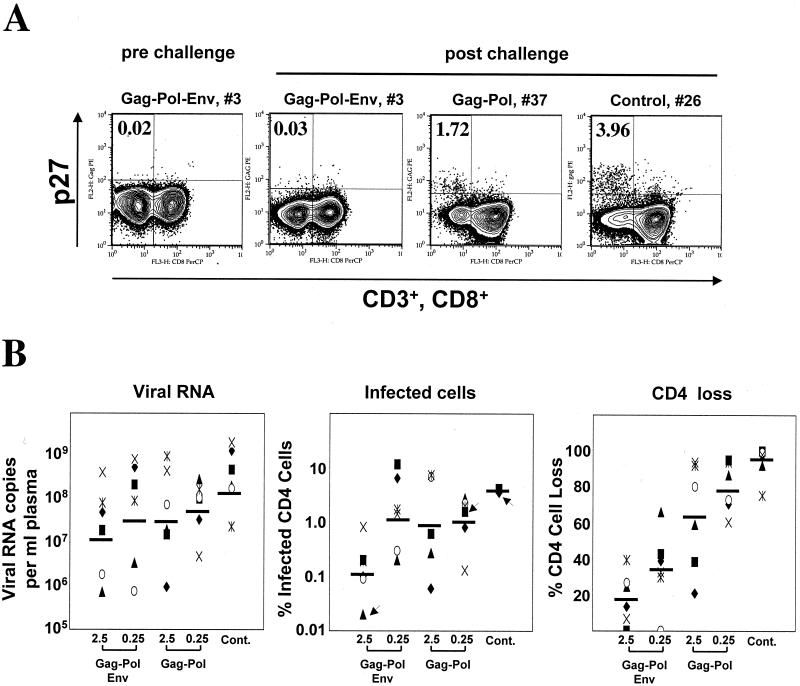
FIG. 6.
Viral loads, infected cells, and CD4+ cell loss in the peripheral blood at 2 weeks postchallenge. (A) Intracellular p27 staining. PBMC were fixed and stained for intracellular Gag, CD3, and CD8. Cells were gated on lymphocytes, followed by CD3, and analyzed for CD8 and Gag. Cells in the left quadrants represent CD4+ cells (CD3 positive, CD8 negative). The frequencies in the upper left quadrant are Gag-positive cells as the percentages of the total number of CD4+ cells (left quadrants). Data are shown for animal 3 prechallenge and animals 3, 37, and 26 postchallenge. Animals were chosen to represent the range of the observed values. Slight differences in the gates in the different panels represent different photomultiplier tube settings for assays run at different times. (B) Comparison of viral loads, numbers of infected cells, and CD4+ cell losses at 2 weeks postchallenge. Geometric means of viral RNA copies and percent infected CD4+ cells and arithmetic means of percent CD4+ cell loss are represented as horizontal bars on the respective graphs. Arrows indicate symbols for the animals whose results are shown in panel A. Cont., control.

