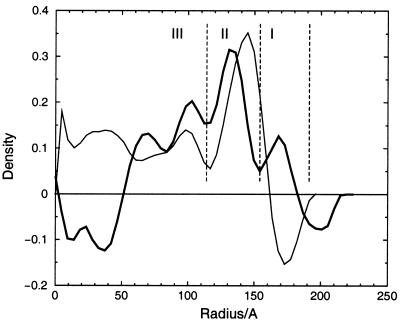
FIG.4.
Radial density distribution of the cryoEM maps of MGNNV (bold line) and PaV (thin line) derived by spherically averaging the density in the maps. The layers of density corresponding to the protrusions, the inner shell of the capsid, and the RNA in MGNNV map are indicated by I, II, and III, respectively.

