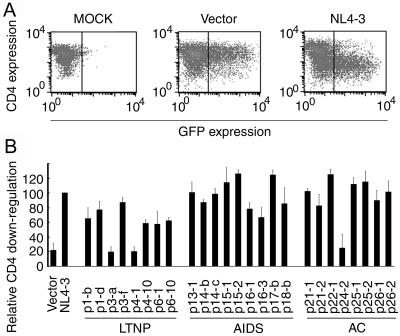
FIG. 5.
Downregulation of cell surface CD4 by Nef derived from LTNPs, AIDS patients, and ACs. (A) MAGIC5D indicator cells were transfected with pCAGGS (MOCK), pCAGGS-IRES-EGFP (Vector), or pCAGGS-IRES-EGFP-4-3-Nef (NL4-3). After 36 h, cells were stained with phycoerythrin-conjugated anti-CD4 monoclonal antibody and were analyzed for fluorescence intensity by FACSCaliber. The vertical bars indicate the thresholds for GFP. (B) pCAGGS-IRES-EGFP (Vector), pCAGGS-IRES-EGFP-4-3Nef (NL4-3), or expression vectors for the nef alleles from patients as indicated at the bottom were transfected and analyzed as described for panel A. After gating for the EGFP-positive cells, the expression level of CD4 was determined as geometric mean fluorescence with CELLQuest software. Relative downregulation efficiency (%) is shown by the following equation: (mean fluorescence intensity of cells expressing NL4-3 Nef)/(mean fluorescence intensity of cells to be evaluated) × 100. Averages from three independent experiments are shown with standard deviations.

